Cost guide
Demand Charges and EV Fast Charging: How Operators Manage Them
EV charging demand charges explained: how the 15-minute peak is billed, what 2019–2026 studies and tariffs show, and a 180 kW worked example of five options.
- Prepared by
- EVCSTAR Engineering Team
- Published
- Reading time
- 4 min
- Sources
- 6 references
At a glance
- Demand charge share of sample bills (NASEO, 2021)
- 73.7%, about US$10 per kW
- Billing basis (US DOE)
- Highest 15-minute average
- PG&E BEV-2 secondary subscription (2026)
- US$1.91 per kW, 50 kW blocks
- New York DC fast credit (PSC, 2023)
- 50% demand charge credit
Key takeaways
- 1Demand charges are usually set by the highest 15-minute average power in the billing period (US DOE), so one badly timed session can set the month's charge.
- 2NASEO found demand charges averaged 73.7% of sample commercial bills and about US$10 per kW across eight US states (2021); the Great Plains Institute put them at 24–39% of a 50 kW station's operating cost and 68–81% at 350 kW (2019).
- 3PG&E's BEV tariff replaces the demand charge with a subscription of US$1.91 per kW in 50 kW blocks (BEV-2 secondary, 2026), plus an overage fee of US$3.82 per kW.
- 4On a 180 kW peak, the options below range from about US$1,800 a month (flat US$10 per kW) to about US$286–382 (subscription), but energy rates differ between tariffs, so compare total bills.
On this page
Short answer: demand charges are the fee for your highest 15-minute peak, and for EV fast charging they can exceed the cost of the energy itself. Operators manage them in three ways: pick the tariff that does not bill the peak the old way, cap the peak in software, and sell more kWh so the charge is spread wider.
How the peak gets billed
One short peak can set the whole month. The US DOE describes demand charges as typically based on the highest 15-minute average use in a billing period, and says DC fast charging is more likely to trigger them than Level 1 or Level 2. The Great Plains Institute (2019) makes the same point: because the charge follows the single highest peak, one session can create a very large charge. A 180 kW cabinet that delivers full power to one vehicle for 15 minutes in a quiet month is billed as if it ran at 180 kW all month.
How big the problem is, from three studies
The share depends on station size and use, but is large almost everywhere.
| Study | Finding |
|---|---|
| Great Plains Institute, 2019 (I-94 corridor rates) | Demand charges are 24–39% of annual operating cost at 50 kW and 68–81% at 350 kW; 150 kW stations break even under about half the rates studied; above 150 kW break-even is nearly impossible except where the utility has no demand charge |
| NASEO / Western Interstate Energy Board, October 2021 (eight states) | Average demand charge 73.7% of the monthly bill, average value about US$10 per kW; sample medium-power bill: US$1,497.57 demand + US$71.32 energy (1,080 kWh) + US$91.74 fees = US$1,660.63 |
| NASEO, same study | In low-use scenarios cost ran from US$5.37 to US$28.62 per kWh; in high-use scenarios every tariff allowed low-cost charging |
Read these as snapshots: they predate the newer tariffs below, and the NASEO sample used a modest 1,080 kWh a month for the medium case.
Five ways to bill the same 180 kW cabinet
Same peak, five bills. We assume a 180 kW peak and compare only the demand-related line. Energy rates are not included, and they differ between tariffs, so total-bill comparisons need your utility’s full rate sheet.
| Option | How it is billed | Demand-related cost per month |
|---|---|---|
| Flat demand charge | 180 kW × about US$10 (NASEO 2021 average) | US$1,800 |
| Same tariff, software cap at 120 kW | 120 kW × US$10 | US$1,200 |
| 50% demand charge credit (New York, public DC fast charging at some utilities) | US$1,800 × 50% | US$900 |
| PG&E BEV-2 secondary subscription | 4 blocks of 50 kW (200 kW) × US$95.56 | US$382 |
| Same subscription, cap at 150 kW | 3 blocks × US$95.56 | US$287 |
Notes on each. New York: in January 2023 the PSC directed utilities to develop the 50% credit; availability depends on the utility and use case. PG&E: the BEV rate replaces the customer charge and the maximum-kW demand charge with a monthly kW subscription (10 kW blocks on BEV-1, 50 kW on BEV-2); exceeding it in a 15-minute interval costs US$3.82 per kW at BEV-2 secondary, and new enrollees get a grace period before overages are billed. PG&E’s energy charges follow time-of-use periods, so the subscription saving is partly offset in the per-kWh price. SCE: its fact sheet says demand charges on TOU-EV-8 (above 20 kW to 500 kW) are currently not applicable until determined by the commission; TOU-EV-7 offers an option without demand charges and higher energy charges. These are California and New York examples. Your utility may offer none of them.
Cap the peak in software
The cheapest lever is the one that needs no hardware. A dual-gun cabinet already shares its power between the two connectors, so the cabinet never exceeds its rating. A site-level cap goes further: set a limit through the charge-point management system using OCPP smart charging (OCPP 2.0.1 improves this; see the standards guide) and chargers reduce power when the site approaches the limit. For AC fleets, group load management on the CPO Series shares a site current limit across up to 10 chargers.
When you decide the cap, use data: pull the 15-minute site load from your first months, find how often the peak exceeds the proposed limit, and compare the cost of those minutes with the monthly saving. Our grid capacity calculator helps set the supply side.
Storage, solar and what we could not price
Batteries and solar shave peaks but add capital cost. NASEO lists on-site storage among the strategies stations use to reduce bills. We did not find a current sourced installed price per kWh of storage for a charging site that we could stand behind, so none is given. Ask two integrators for quotations and put the result against the monthly demand line above; if the payback exceeds the equipment life, a tariff change or a cap is the better route.
How this relates to EVCSTAR equipment
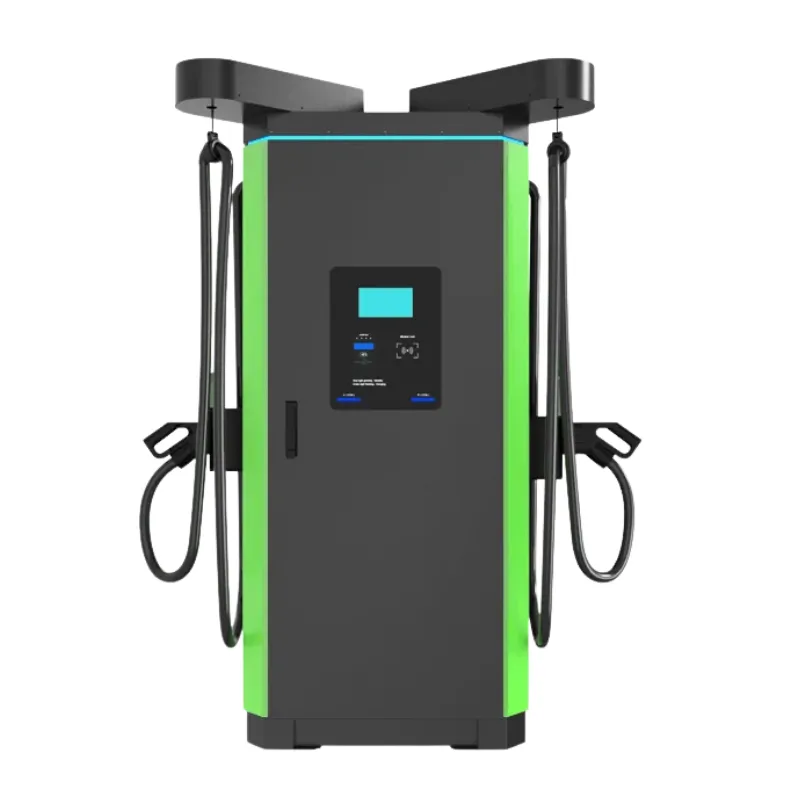
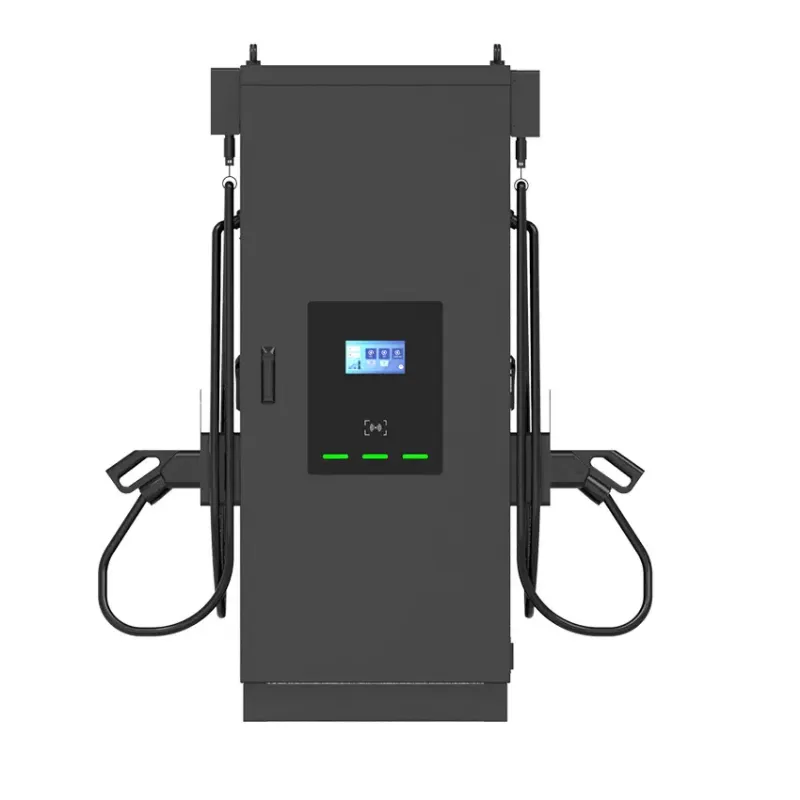
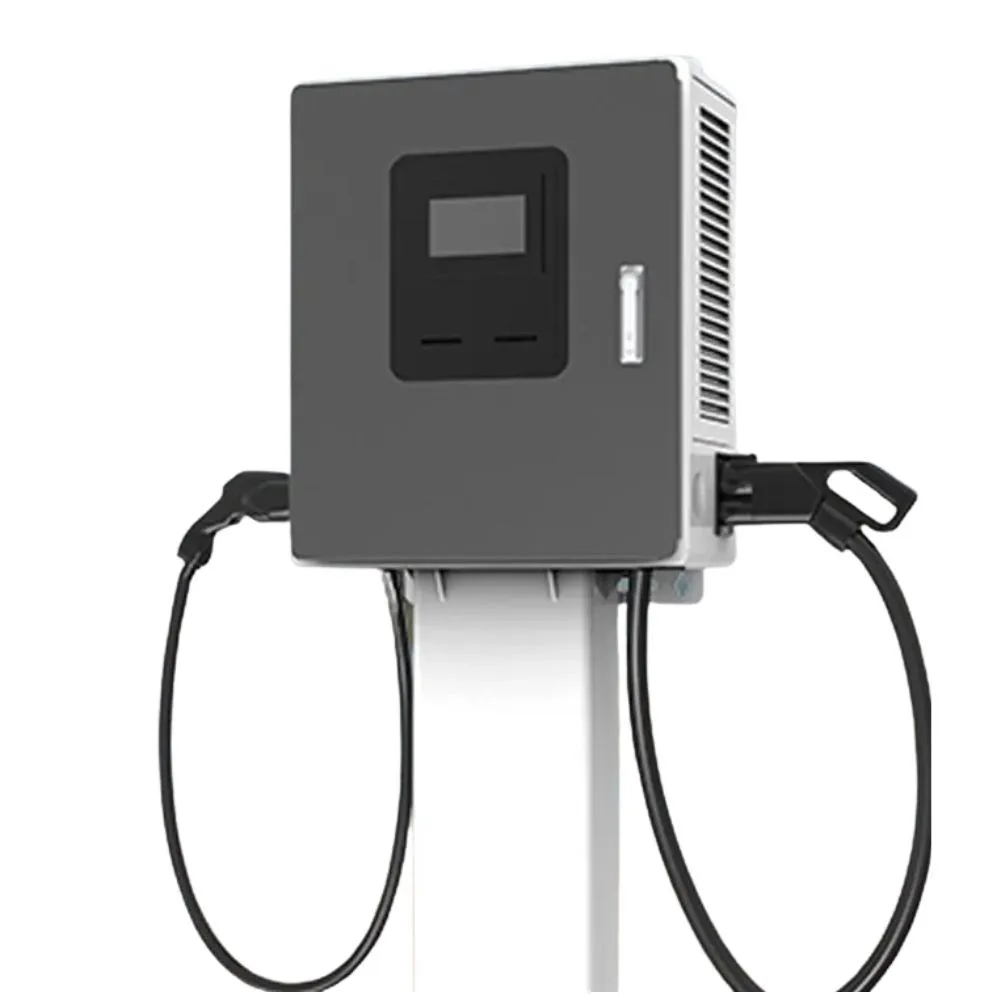
Choose the power class that your tariff can bear. The UC Series and CC Series share power between two guns and run on OCPP 1.6J and 2.0.1; the HC Series at 20–60 kW has a much lower peak for sites on punishing demand tariffs. Whether a given model accepts a configurable site-level cap through your back-end should be confirmed in the quotation. Price depends on your configuration, so send us your site data through the contact page and we will return a configured quotation. Test your tariff and volumes in the payback calculator.
Payback calculator
Example values are filled in — replace them with your own quotation, tariff and traffic figures.
- Energy sold per month
- —
- Net margin per month
- —
- Simple payback
- —
Simple payback = total investment ÷ (energy sold × (price − energy cost) − fixed costs), using 30 days per month. Taxes, financing, subsidies and utilisation growth are not included.
Frequently asked questions
- What is a demand charge on an EV charging bill?
- A fee per kW of your highest measured power in the billing period, on top of the per-kWh energy charge. The US DOE says it is typically based on the highest 15-minute average, and that DC fast charging is more likely to trigger it than Level 1 or Level 2.
- Are demand charges the same everywhere?
- No. NASEO found everything from no demand charge to very high rates across eight US states. Some utilities offer subscription, phase-in or capped options. Outside the US, network tariffs may use capacity charges instead, so ask the grid operator how the connected capacity is billed.
- Will a battery remove my demand charge?
- It can lower the grid peak by supplying part of the power during sessions, but a battery has its own capital cost and we found no sourced price to quote here. Test the cheaper levers first: tariff selection and a software power cap.
- Does capping charger power cost me customers?
- Only when many cars charge at once. A cap of 120 kW on a 180 kW cabinet still gives most vehicles the power they accept, and it avoids paying for a peak that occurs a few times a month. Check your own session logs before setting it.
References
- [1]Demand Charges & Electric Vehicle Fast-Charging: An Intermountain West Assessment. NASEO, Western Interstate Energy Board and Utah Clean Cities (October 2021).
- [2]Demand charges and DC fast charging. Great Plains Institute (31 July 2019).
- [3]Electric Schedule BEV, Business Electric Vehicles. Pacific Gas and Electric (tariff book, retrieved October 2026).
- [4]PSC Approves Beneficial Utility Rates for Electric Vehicle Charging Stations. New York State Public Service Commission (19 January 2023).
- [5]TOU-EV-7, TOU-EV-8, TOU-EV-9 rate fact sheet. Southern California Edison (2026).
- [6]Electricity Infrastructure Maintenance and Operation. US DOE Alternative Fuels Data Center.