Cost guide
DC Charging Station Operating Costs: Energy, Demand, Network, Upkeep
EV charging station operating cost for a 180 kW DC site: a monthly bill of energy, demand charge and upkeep with sources, and the break-even price per kWh.
- Prepared by
- EVCSTAR Engineering Team
- Published
- Reading time
- 4 min
- Sources
- 5 references
At a glance
- US commercial electricity, Aug 2026 (EIA)
- 14.47 cents per kWh
- Demand charge average (NASEO, 2021)
- About US$10 per kW
- Maintenance (DOE)
- Up to US$400 per charger a year
- DC fast extended warranty (CEC via DOE)
- Over US$800 per charger a year
Key takeaways
- 1In the worked example below, a 180 kW dual-gun site selling 18,000 kWh a month has sourced running costs of about US$4,505, or US$0.25 per kWh, before network fees, payment fees, rent, insurance and staff.
- 2Energy at the August 2026 US average commercial price (14.47 cents per kWh, EIA) is the largest line at US$2,605; the demand charge at the NASEO 2021 average of about US$10 per kW adds US$1,800.
- 3The cost per kWh falls from about US$0.36 to about US$0.20 when volume rises from 9,000 to 36,000 kWh a month, because the demand charge and fixed costs are spread over more energy.
- 4The US DOE advises up to US$400 per charger per year for maintenance and cites DC fast charger extended warranties above US$800 per charger per year.
On this page
Short answer: the monthly operating cost of a DC charging station is a bill with five lines, and two of them (energy and demand) are about 98% of what is sourced in the example below. Put your own kWh, peak kW and tariff into the table and you have a first number to compare with your selling price per kWh.
The example site and its assumptions
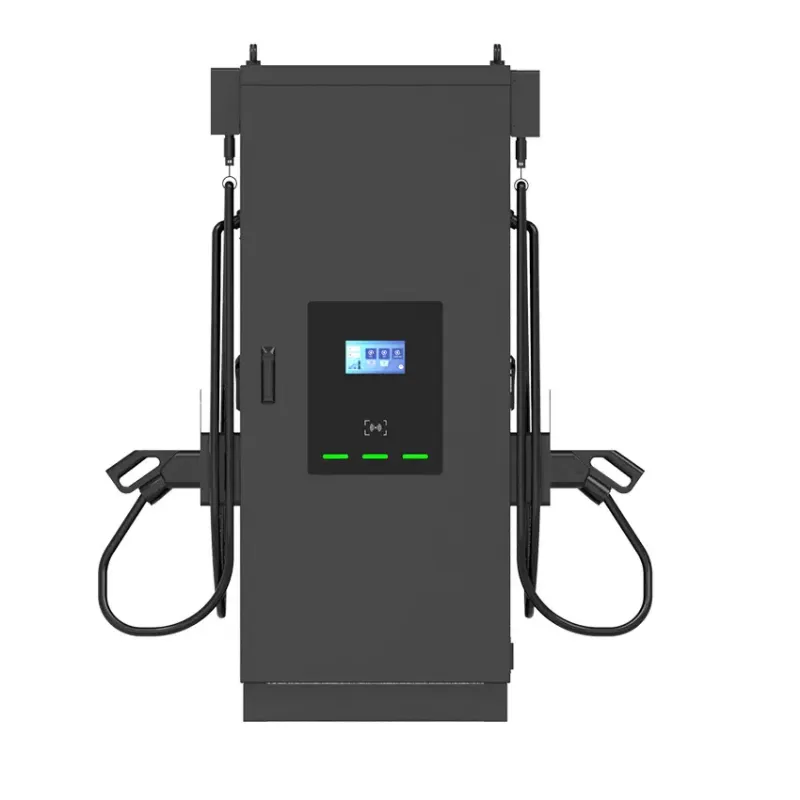
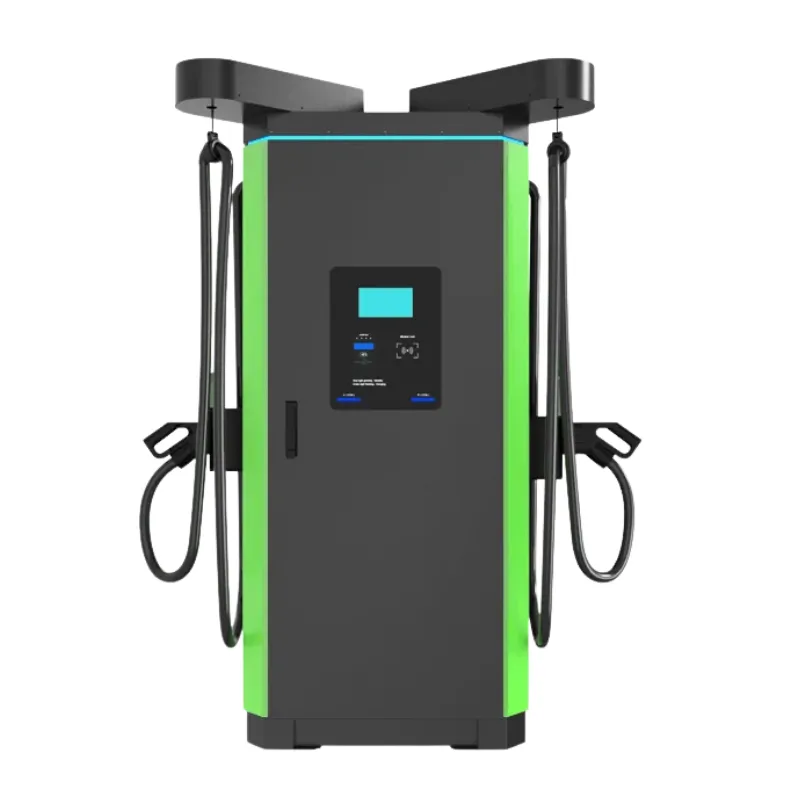
One cabinet, two guns, 180 kW peak, 600 kWh a day. We use a CC180-class charger. The assumptions are ours, to show the method:
- 20 sessions a day at 30 kWh each = 600 kWh a day, or 18,000 kWh over 30 days (about 14% of the cabinet’s 180 kW capacity if it ran flat out, counted by energy).
- Energy at the EIA US average commercial price for August 2026, 14.47 cents per kWh. Real EV tariffs can differ widely.
- Peak demand 180 kW at about US$10 per kW per month, the average NASEO found in 2021 across its sample of tariffs. Real rates range from zero to well above this.
The monthly bill, line by line
Sourced lines total about US$4,505; unsourced lines are listed so you do not forget them.
| Cost line | Calculation | Per month |
|---|---|---|
| Energy | 18,000 kWh × US$0.1447 | US$2,605 |
| Demand charge | 180 kW × US$10 | US$1,800 |
| Maintenance | Up to US$400 a charger a year ÷ 12 (DOE) | About US$33 |
| Extended warranty | Over US$800 a charger a year ÷ 12 (CEC, via DOE) | About US$67 |
| Network software | From your platform quotation | Not sourced |
| Payment processing | A percentage or fixed fee per session | Not sourced |
| Site lease, insurance, cleaning, support | Local quotations | Not sourced |
| Sourced total | About US$4,505 |
Divide by 18,000 kWh: about US$0.25 per kWh of cost before the unsourced lines. Your selling price has to cover the rest and leave margin. EVCSTAR chargers carry a 12-month warranty; the extended-warranty line is the cost after it, see warranty.
What happens as volume changes
Fixed lines do not shrink when traffic is slow. The same site, same assumptions, three volumes:
| kWh sold per month | Energy | Demand | Maintenance and warranty | Total | Cost per kWh |
|---|---|---|---|---|---|
| 9,000 | US$1,302 | US$1,800 | US$100 | US$3,202 | US$0.36 |
| 18,000 | US$2,605 | US$1,800 | US$100 | US$4,505 | US$0.25 |
| 36,000 | US$5,209 | US$1,800 | US$100 | US$7,109 | US$0.20 |
NASEO modelled the extreme end: in its low-use scenarios the average cost per kWh ran from US$5.37 to US$28.62, against EIA transportation-sector electricity at about US$0.10 per kWh; in its high-use scenarios every tariff studied allowed low-cost charging. The Great Plains Institute (2019) found demand charges were 24–39% of annual operating cost for a 50 kW station and 68–81% at 350 kW.
Levers that move the bill
Four levers, in order of usual impact.
- Tariff choice. Ask the utility for every EV or time-of-use option. New York’s PSC directed utilities to develop a 50% demand charge credit for public DC fast charging at some of them (January 2023); California’s PG&E offers a kW subscription instead of a demand charge (see our demand charge guide). In the NASEO sample, five of the 11 least expensive low-use rate classes had no demand charge.
- Power cap. Capping the site at 120 kW cuts the demand line by a third in the example (120 × US$10 = US$1,200), at the cost of slower sessions at peak.
- Utilisation. Every extra kWh sold dilutes the fixed lines. Charger placement and dwell-time fit matter more than another 10 kW.
- Maintenance. An uptime plan is cheaper than a dead cabinet; the DOE recommends estimating maintenance as a line, not hoping for none.
Why the operating bill is part of the purchase decision
The cheaper cabinet can be the costlier site. A 180 kW charger raises the demand line compared with 120 kW, but also sells more energy per hour when vehicles can take it. Compare both with real session data rather than rated power. The payback calculator takes your price, energy cost and sessions; the grid capacity calculator tells you whether the supply allows the power class.
How this relates to EVCSTAR equipment
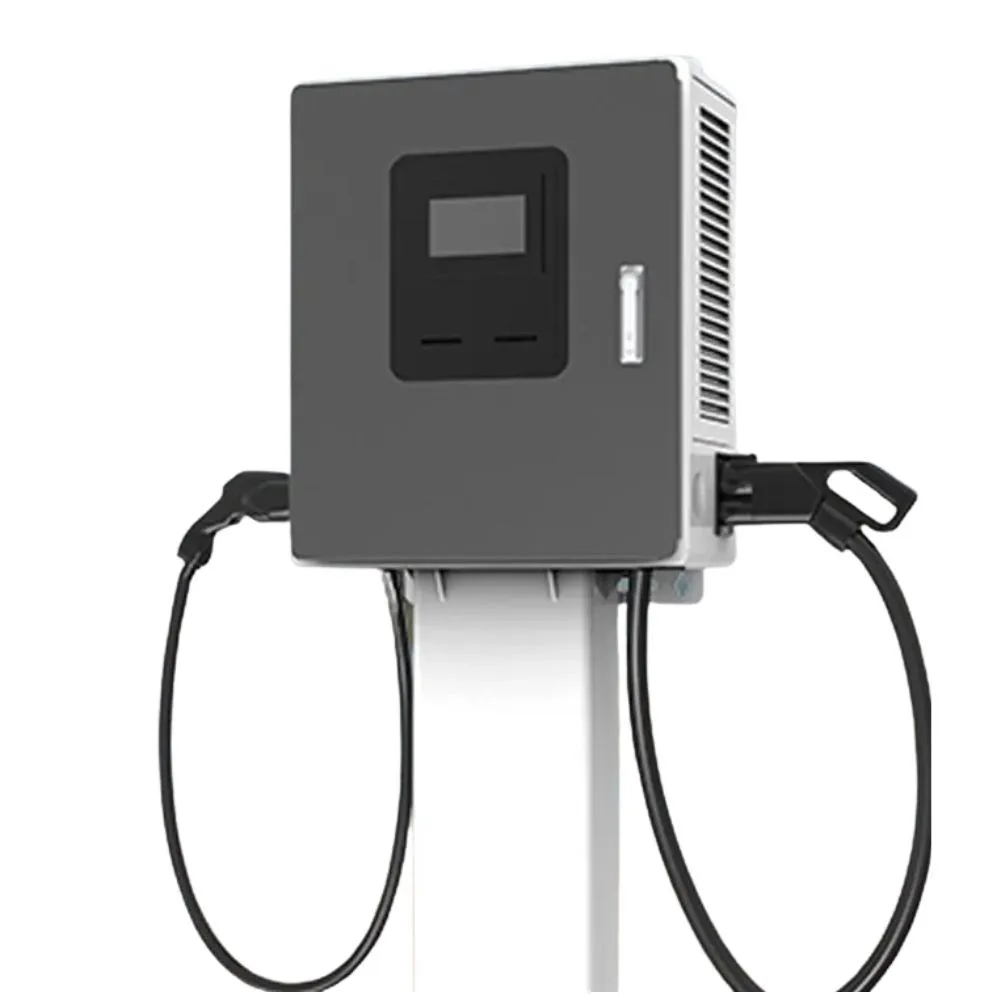
Choose the series by dwell time, then size the bill. The CC Series (120 or 180 kW) suits retail and urban stops, the UC Series suits corridor and fleet sites with high volume, and the HC Series is the lower-power wall or pedestal option where a smaller peak keeps the demand line low. Price depends on your configuration, so for a configured quotation use the contact page, and bring your utility tariff so we can check the input current and peak against it.
Payback calculator
Example values are filled in — replace them with your own quotation, tariff and traffic figures.
- Energy sold per month
- —
- Net margin per month
- —
- Simple payback
- —
Simple payback = total investment ÷ (energy sold × (price − energy cost) − fixed costs), using 30 days per month. Taxes, financing, subsidies and utilisation growth are not included.
Frequently asked questions
- What is the biggest operating cost of a DC fast charging station?
- Electricity, in two parts: the energy you resell and the demand charge. NASEO's 2021 study of eight US states found demand charges averaged 73.7% of the sample commercial bills across all scenarios, so at modest volumes the demand charge can outweigh the energy itself.
- How do I estimate the monthly bill for my own site?
- Multiply expected kWh by your tariff's energy rate, add peak kW times the demand rate, then add maintenance, warranty, network and payment fees. Put the totals into the payback calculator with your selling price per kWh.
- Are network and payment fees included in the example?
- No. We found no independent published figure for them, so they are left as lines for you to fill from your platform and payment provider quotations. The example is therefore a floor, not a full cost.
- Can the demand charge be reduced?
- Sometimes. In January 2023 New York's regulator directed utilities to develop a 50% demand charge credit for public DC fast charging at some of them, and California has a subscription tariff. Rates vary by utility, so ask yours which EV tariffs are open to your site.
References
- [1]Electric Power Monthly, Table 5.6.A. US Energy Information Administration (August 2026 data).
- [2]Demand Charges & Electric Vehicle Fast-Charging: An Intermountain West Assessment. NASEO, Western Interstate Energy Board and Utah Clean Cities (October 2021).
- [3]Electricity Infrastructure Maintenance and Operation. US DOE Alternative Fuels Data Center.
- [4]PSC Approves Beneficial Utility Rates for Electric Vehicle Charging Stations. New York State Public Service Commission (19 January 2023).
- [5]Demand charges and DC fast charging. Great Plains Institute (2019).