Business guide
Fleet Depot Charging: Building the Business Case
Fleet depot EV charging business case with a worked example: at 36,000 km a year the electric premium does not pay back in 5 years; at 60,000 km it breaks even.
- Prepared by
- EVCSTAR Engineering Team
- Published
- Reading time
- 4 min
- Sources
- 3 references
At a glance
- ICCT/RAP holding period modelled
- 5 years
- ICCT/RAP electricity vs diesel cost per km
- 30–60% lower
- AFDC Level 2 install, per connector
- ~$2,500
- Worked example break-even distance
- ~60,000 km/van/yr
Key takeaways
- 1Distance decides the case. In our worked example (assumptions stated below), 20 vans saving about $0.113 per km against diesel need roughly 60,000 km a year each to recover a $25,000 vehicle premium plus $9,000 of depot cost per van in five years; at 36,000 km they fall short by about $272,500.
- 2The ICCT and RAP study of last-mile delivery in six European cities (2022) found the same pattern: electricity cost per km was 30% to 60% lower than diesel, but low annual mileage (15,000 km in its use case) limits how much of the higher vehicle price operators can recover.
- 3Charging hardware is the smaller part of the gap, but it is the part you control: the U.S. Alternative Fuels Data Center puts Level 2 equipment at about $3,500 and installation at about $2,500 per public or workplace connector, with labour the largest installation cost and per-charger cost falling on larger installations.
- 4Utilities, demand charges and managed charging belong in the model from day one; depot charging usually happens overnight, which is when load management can keep the peak, and the demand charge, down.
On this page
Short answer: the business case for fleet depot EV charging turns on how many kilometres each vehicle drives, not on the charger. In the worked example below, a van saving $0.113 per km needs about 60,000 km a year to repay its purchase premium and depot cost within five years.
What the research says about delivery fleets
Cheaper energy does not help much if the vehicle barely moves. ICCT and RAP (June 2022) modelled battery-electric last-mile trucks against diesel in Berlin, Paris, Rome, London, Warsaw and Amsterdam over a five-year first-owner period. Their use case: 50 km a day for 300 days, or 15,000 km a year, served by a depot of ten 22 kW chargers for 23 vehicles using dynamic load management. Electricity cost per km was 30% to 60% lower than diesel, yet the report says low mileage limits how far operators can offset the higher vehicle price and the charging infrastructure. They found parity in most of the cities with the purchase premiums available at the time, and in the second half of the decade without them.
That is Europe, 2022, for large vans. It is a reason to test your own numbers, not a forecast for your fleet.
A worked example with stated assumptions
Twenty vans, one depot, five years. Every input below is our assumption for illustration, not an EVCSTAR price and not data for any real fleet. Replace each with your own.
| Input | Diesel van | Electric van |
|---|---|---|
| Energy use | 9 L/100 km | 0.27 kWh/km at the meter, losses included |
| Energy price | $1.40 per L | $0.14 per kWh |
| Maintenance | $0.06 per km | $0.035 per km |
| Purchase premium over diesel | none | $25,000 per van |
| Depot (hardware, installation, supply upgrade) | none | $9,000 per van ($180,000 for 20) |
For the depot line we used AFDC’s public Level 2 averages of about $3,500 equipment plus $2,500 installation per connector, which is $6,000 a connector, plus a $3,000 per van allowance for a supply upgrade. 22 kW units will cost more than the AFDC average; treat it as a placeholder for a quotation.
At 36,000 km a year (120 km a day, 300 days): diesel energy is $4,536 a van, electricity $1,361, maintenance $2,160 against $1,260. Saving: $4,075 a van a year, or $0.113 per km. Simple arithmetic, no discounting, no resale value, no financing.
| Annual km per van | Saving over 5 years, 20 vans | Extra cost (20 × $34,000) | Net |
|---|---|---|---|
| 36,000 | $407,500 | $680,000 | −$272,500 |
| 60,000 | $679,167 | $680,000 | about break-even |
| 90,000 | $1,018,750 | $680,000 | +$338,750 |
If the vehicle premium were $10,000 instead of $25,000, the 36,000 km case would clear its cost by about $27,500. The premium and the distance dominate; the charger price barely moves the answer.
Where depot costs hide
Utility, demand and labour move the result more than charger prices. AFDC says labour is the largest installation cost and per-charger cost falls significantly on larger installations; it also advises talking to the utility early about upgrade needs, because demand charges, electricity and network fees sit in operating cost. A depot that plugs in twenty vans at 18:00 will set a high peak; staggered or managed charging flattens it. The demand charges guide shows the arithmetic and the grid capacity calculator gives the peak for your fleet.
Pick hardware that speaks OCPP 1.6 or higher, so you can change the management software without replacing chargers (AFDC advice).
Money outside the base case
Incentives are real but dated, so keep them outside the base case. The IRS Section 30C page (updated May 2026) lists 6% of cost for businesses, or 30% with prevailing wage and apprenticeship requirements, capped at $100,000 per item, for property placed in service through 30 June 2026. Other countries and utilities run their own programmes; verify the status and deadline of each. Show the case with and without them, and use the payback calculator for utilisation-based scenarios. The financing guide covers owning versus leasing.
Sizing the depot, then asking for a quote
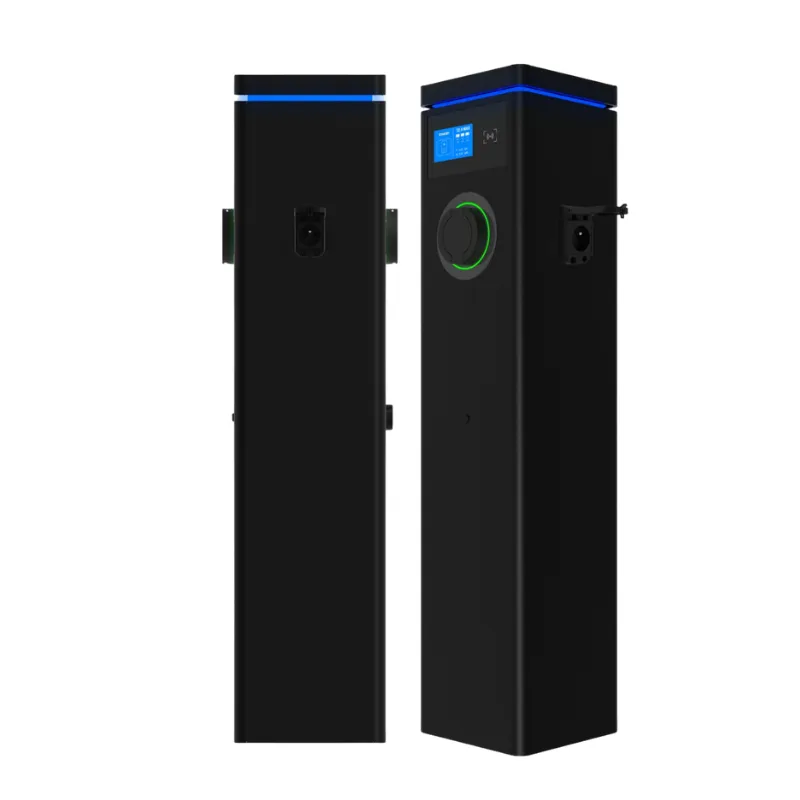
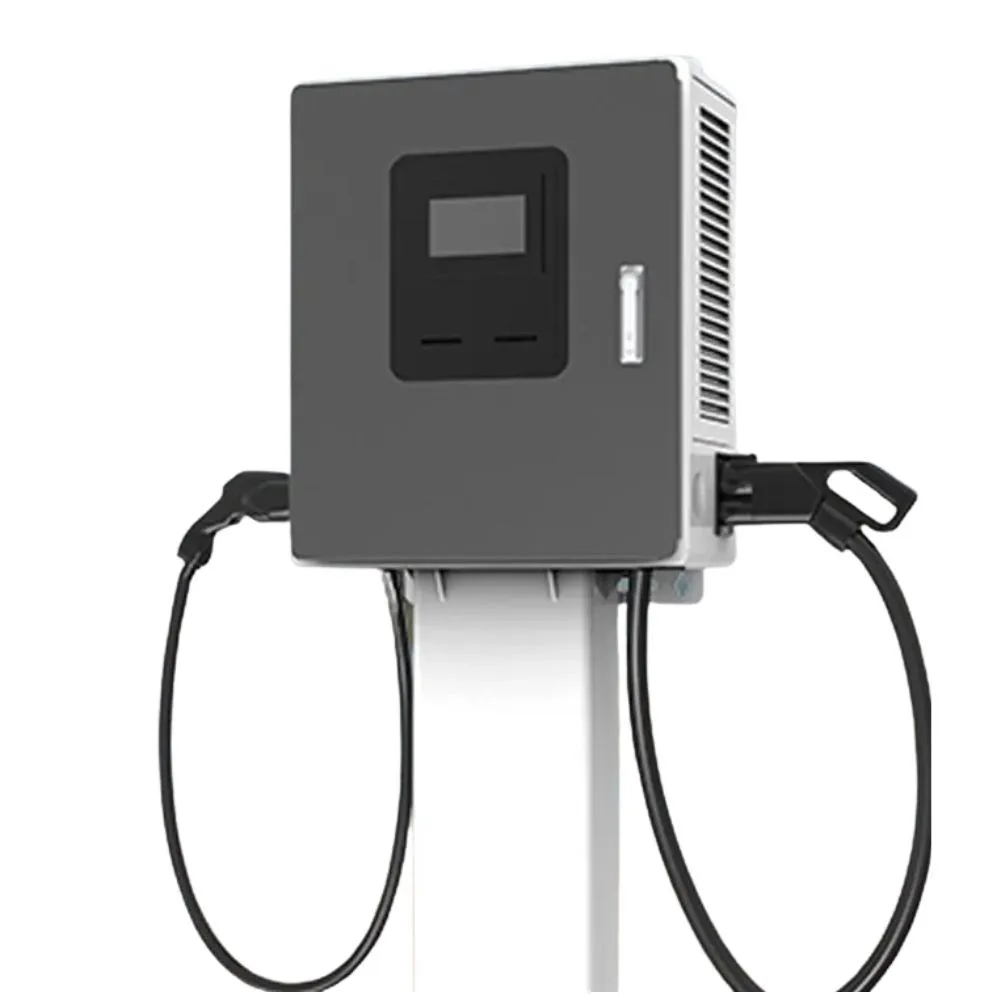
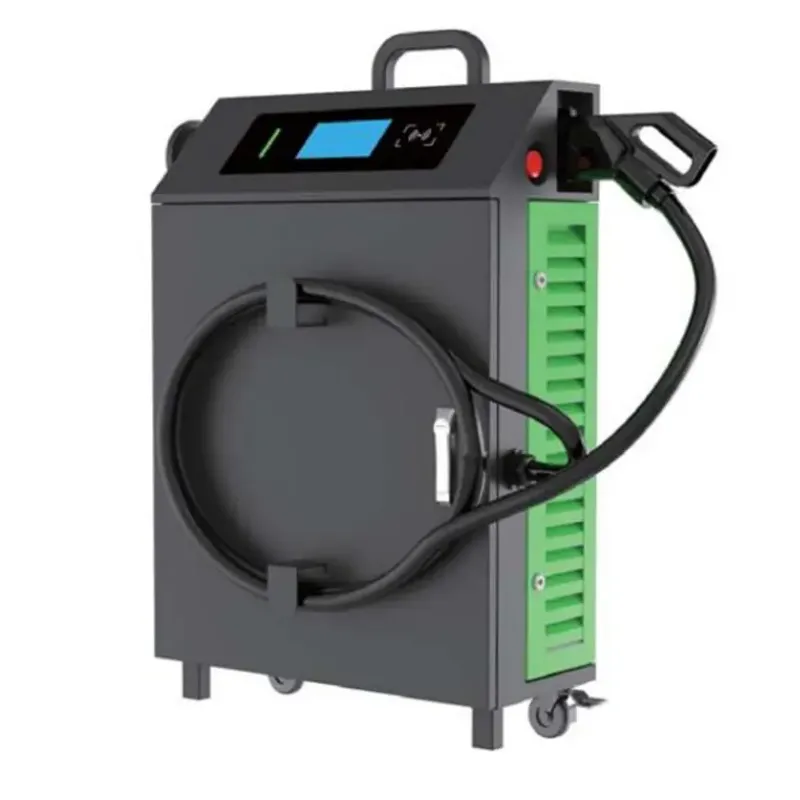
Work backwards from the morning departure. For each vehicle, multiply daily kilometres by kWh per km, divide by the hours parked, and add a margin. Overnight dwell often points to AC: the CPO series offers two 3.7 to 22 kW outlets per cabinet. Where turnarounds are short, the HC series gives 20 to 60 kW DC from a wall or pedestal, and the MC series is a movable 20 to 80 kW option for sites that cannot take fixed equipment.
Price depends on the configuration, so send us the vehicle types, daily distance, parking hours, supply voltage and the capacity your utility offers through the contact page. We will return a configured quotation with the number of connectors, cable and connector set, and options listed separately.
Payback calculator
Example values are filled in — replace them with your own quotation, tariff and traffic figures.
- Energy sold per month
- —
- Net margin per month
- —
- Simple payback
- —
Simple payback = total investment ÷ (energy sold × (price − energy cost) − fixed costs), using 30 days per month. Taxes, financing, subsidies and utilisation growth are not included.
Grid capacity calculator
- Spare power for charging
- —
- Input current per charger (400 V)
- —
- Chargers at full power
- —
Spare power = kVA × 0.95 power factor × (1 − margin) − existing peak load. Input current ≈ charger kW ÷ (√3 × 400 V), with power factor and 95 % efficiency added for DC chargers. With dynamic load management more chargers can share the same capacity at reduced power. Always confirm with your electrical engineer and the grid operator.
Frequently asked questions
- How long does depot charging take to pay back?
- It depends on kilometres per vehicle more than on anything else. In the worked example on this page, 20 vans at 36,000 km a year do not recover their extra cost within five years, at 60,000 km they roughly break even, and at 90,000 km they gain about $338,750. Replace our assumptions with your own fuel prices, tariffs and vehicle quotes.
- Do I need DC chargers at a depot?
- Often not. Vans that return in the evening and leave in the morning can charge on AC. DC suits vehicles with short turnarounds, mixed shifts or large batteries; a 20 to 60 kW wall or pedestal DC unit is a middle option. Work out energy per vehicle per night and the hours available before choosing.
- Is there a tax credit I can count on?
- In the United States, the IRS page we read says the Section 30C credit (6% of cost, or 30% with prevailing wage and apprenticeship rules, up to $100,000 per item for businesses) applies to property placed in service through 30 June 2026. We left it out of the example. Ask a tax adviser about your country and date.
- What will EVCSTAR equipment cost for my depot?
- It depends on configuration: power per vehicle, number of connectors, cable and connector set, back-end and payment options, and site conditions. Send us your vehicle list, daily distance, parking hours and supply capacity through the contact page and we will return a configured quotation with a breakdown.
References
- [1]Electrifying last-mile delivery: A total cost of ownership comparison of battery-electric and diesel trucks in Europe. ICCT and RAP, June 2022.
- [2]Infrastructure Development for Electric Vehicle Charging. U.S. Department of Energy, Alternative Fuels Data Center.
- [3]Alternative Fuel Vehicle Refueling Property Credit (Section 30C). Internal Revenue Service, page updated May 2026.